


Application of Remote Sensing to Coastal Management
Editor: Dr Alasdair.J.Edwards, University of Newcastle, UK.
This module consists of 10 lessons that look at the uses of airborne and satellite data for costal management. The Module has been revised and extended to take advantage of new features of the Bilko v3 software. Individual lessons are described below; images and headings link to more details of each lesson.
The module is available in PDF format as a single file. Images and tools (formulas, palettes etc.) for individual lessons can be downloaded as separate zip files.
Download the module:
|
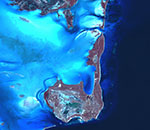
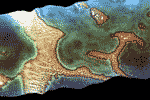
1. Visual interpretation of images with the help of colour compositesThis lesson teaches how to interpret satellite and airborne digital imagery visually, relate features revealed on images to features on the Earth's surface, and understand how images can help in planning field survey. |
|
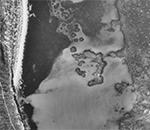
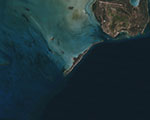
2. Selecting images of appropriate scale and spatial resolutionThis lesson demonstrate the effects of image spatial resolution (ranging from 1 m to 80 m) on your ability to discriminate between different coastal habitats. |
|
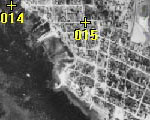
3. Geometric correction of an aerial image of South CaicosThis lesson teaches how to rectify an image to a Universal Transverse Mercator (UTM) coordinate system and explains why it is important to carry out geometric correction of remotely sensed images. |
|
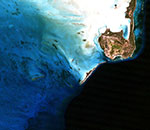
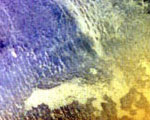
4. Radiometric correction of satellite images: when and why it is necessary
This lesson explains the concepts underlying radiometric correction and shows how to carry out the radiometric correction of satellite imagery,
using two Landsat Thematic Mapper images obtained at different seasons under different atmospheric conditions as examples. |
|
5. Removing sunglint from Compact Airborne Spectrographic Imager (CASI) imageryThis lesson shows you how to remove sun glint from high resolution airborne and satellite imagery to reveal bottom features and improve classification. |
|
6. Crude bathymetric mapping using Landsat TM imageryThis lesson shows how bathymetry can be crudely mapped using digital optical imagery and the limitations of the results in terms of accuracy. |
|
7. Compensating for variable water depth to improve mapping of underwater habitats: why it is necessaryUsing a CASI airborne image, this lesson teaches you how to carry out 'depth-invariant' processing in order to compensate for the effect of light attenuation in the water column (i.e. water depth) on bottom reflectance. |
|
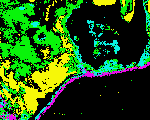
8. Mapping the major inshore marine habitats of the Caicos Bank with Landsat TMThis lesson teaches how to undertake a simple supervised classification of a Landsat TM image to show the major marine and terrestrial habitats of the Caicos Bank. |
|
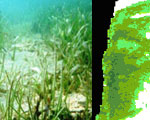
9. Predicting seagrass standing crop from SPOT XS satellite imageryThis lesson shows how to derive a map of seagrass standing crop from a SPOT XS or similar appropriate image. |
|
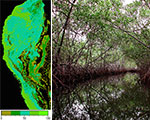
10. Assessing mangrove leaf-area index (LAI) using CASI airborne imageryThis lesson shows how to assess and map mangrove leaf-area index (LAI) using Compact Airborne Spectrographic Imager (CASI) imagery as an example. |
 Previous: Selected Envisat Lessons
|
Last update: 20 August 2018 | Contact |  |
Site Policy |
Next: M8 Fisheries

|