|
EAMNet lectures and tutorials |

|

The Europe Africa Marine Earth Observation Network (EAMNet - 2010-2013) was a collaborative project linking marine Earth Observation (EO)
information providers, user networks and centres of excellence in Europe and Africa.
Building on existing infrastructure and expertise in Africa, the project created a Marine Earth Observation Masters of Science (MSc) module in African universities, teaching the skills needed to download, interpret and analyse marine EO data. EAMNet was co-ordinated by Plymouth Marine Laboratory (PML) and involved partners from five European and four African countries. Some of the lectures and hands-on lessons created by EAMNet parners for the MSc module are available below.
Hands-on computing exercises
The hands-on lessons listed below have been developed to support users of EAMNet marine data distributed via GEONETCast. Data similar to that used in the lessons, but from other African regions, are available from the The Chlorogin Data Portal.
Each of the lessons includes background information, detailed instructions for how to carry out the images processing and analysis required, questions to test understanding, and model answers which explains the reasoning used to obtain the answers. The lessons come complete with all data and tools required to perform the lesson activities.

|
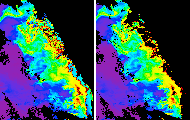
Applying flags to MODIS ocean colour (OC) images
This lesson introduces you the bitwise operators we need in order to extract and apply individual flags to MODIS SST and ocean colour data. The method is general, and may be applied to any data-type with associated 'flag codings' and 'flag bands'.
|

|
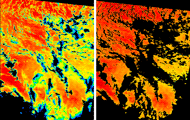
Using Analysis SST to clear residual cloud from MODIS SST data
Cloud top temperatures are usually much lower than sea surface temperatures. The presence of undetected sub-pixel cloud may therefore lower the apparent SST in MODIS images. This lesson shows how to use a lower resolution analysis data with the MODIS data to mask pixels that are likely to suffer from such cloud contamination.
|

|
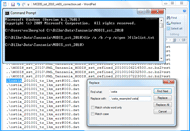
Creating quality-checked weekly composites of MODIS SST
This lesson builds on work carried out in the lesson on clearing residual sub-pixel cloud from MODIS data. It explains how to create lists of files held the different data directories, and how to edit these in a text editor to create Bilko sets for quality control of multiple images. Once clouds have been masked in the individual data sets, the lesson shows how to merge these into weekly images for further analysis of coral bleaching risk.
|
Annotated lectures from the EAMNet MSc module
The lectures below were developed for the EAMNet MSc module developed at the universities of Cape Town, Ghana and Dar-es-Salaam. PDF versions may be downloaded directly from links in the list below. To download the Power Point versions, you first need to register as a Bilko user.
- Applications of Ocean Colour. (15.6 MB)
- Optical remote sensing: theory, models and algorithms. (6.4 MB)
- Ocean Colour processing and products. (16.6 MB)
- Introduction to Radar Remote Sensing. (3.3 MB)
- An introduction to Synthetic Aperture Radar observations (19.5 MB)
- A short course on Altimetry (12.1 MB)
To allow the presentations to be delivered by trainers other than the original authors, Powerpoint versions of these lectures also contain notes explaining each slide. The notes should be sufficiently detailed for the presentations to be useful also for students working alone or with limited supervision. If you have questions about individual presentations or slides that are not answered in the supporting notes, please contact the Bilko project office (bilko@noc.ac.uk) for further clarification.
Download the annotated power point lectures
 Previous: DevCoCast Lessons
|
Last update: 22 January 2021 | Contact |  |
Site Policy |
Next: C-RISe Lessons

|


