


|
|
C-RISe Lessons |
In partnership between the UK, Mozambique, Madagascar and South Africa, the Coastal Risk Information Service (C-RISe)
was set up to provide access to information on sea level, storm surge, wind speed and wave heights, and to demonstrate
though a series of use cases, how marine Earth Observation data may be used to provide improved regional information on coastal risk factors
to protect communities and safeguard economics activity in Madagascar, Mozambique and South Africa.
C-RISe Website
The hands-on lessons listed below have been developed to support users of marine data available from global archives of satellite data products. The lessons includes background information, detailed instructions for how to process and analyse the data, questions to test understanding, and model answers which explains the reasoning used to obtain the answers. The lessons come complete with all data and tools required to perform the lesson activities.
|
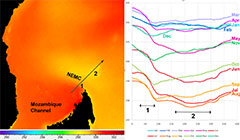
Using a monthly SST climatology to analyse seasonal variability
This lessons uses Bilko in batch mode to calculate a monthly sea surface temperature (SST) climatology for the Western Indian Ocean
based on 15 years of monthly multi-sensor, ultra high resolution (MUR) SST analysis data.
The method is general, and may be applied to any time series of image data.
|
|
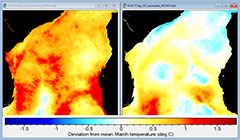
Using monthly SST anomaly data to explore inter-annual variability
This lessons uses Bilko in batch mode to calculate a monthly anomaly time series for the Mozambique Channel based on
the 15 year time series of MUR SST analysis data used in Lesson 1, and display data for each month using an anomaly palette.
|
 Previous: EAMNet Lessons
|
Last update: 19 January 2021 | Contact |  |
Site Policy |
Next: Bilko users

|