


Mini-Lesson 8: Vegetation Indices
Lesson Aims:
|
To introduce you to some advanced uses of formula documents to create a range of vegetation indices. Objectives:By the end of this mini-lesson you will have been introduced to a range of two-band and three-band vegetation indices, explored how to use formula documents to implement these, and seen how libraries of generic formulae (in this case, for mapping vegetation) can be created. This mini-lesson assumes that you have completed the Introduction to Bilko 3.2 Tutorial 10: Using formulas to perform calculations on images. We recommend that you have also studied Mini-lesson 3: Advanced use of formulas. Download the lesson:
Content OverviewThis mini-lesson introduces you to a range of "vegetation indices". A vegetation index is a quantitative measure that is related to biomass or vegetative vigour. It is usually formed from combinations of two or three spectral bands (with red and near-infrared being most common), whose values are added, divided, or multiplied in order to yield a single value (index) that indicates the amount or vigour of vegetation. Many natural surfaces are about equally as bright in the red and near-infrared part of the spectrum with the notable exception of green vegetation. Red light is strongly absorbed by photosynthetic pigments (such as chlorophyll a) found in green leaves, whereas near-infrared light either passes through or is reflected by live leaf tissues, regardless of their color. This means that areas of bare soil having little or no green plant material will appear similar in both the red and near-infrared wavelengths, whereas areas with much green vegetation will be very bright in the near-infrared but relatively dark in the red part of the spectrum. Thus, the simplest form of vegetation index is a ratio between near-infrared and red reflectance. For healthy living vegetation, this ratio will be high due to the inverse relationship between vegetation brightness in the red and near-infrared regions of the spectrum. The following two-band vegetation indices are described and implemented and their results compared:
Then two three-band indices are described and implemented using formula documents:
Sample images:A selection of images from this mini lesson are shown below. |
|
|
|
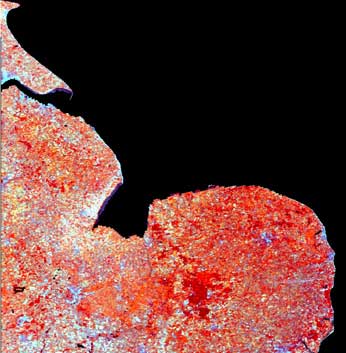
Colour composite of the MERIS reflectance images with near infra-red band (#13) displayed through the red channel, blue band (#3) through the blue channel, and green band (#5) through the green channel. The most densely vegetated areas (brightest on the NDVI image) show as deepest red. |
||
|
||
|
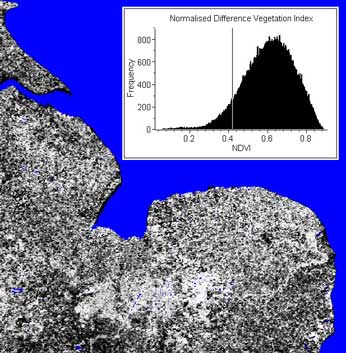
NDVI image of East Anglia and Lincoln area of England with water (set to null) given a blue palette and a histogram of the NDVI values on land inset. |
|
Histograms to show relative reflectances of same areas of East Anglia, United Kingdom in red (band 7) and near infra-red (band 13) wavebands in a MERIS image. Note relatively high reflectance in the infra-red. |
|
|
|
Comparison of various two-band vegetation indices against NDVI for pixels along a transect across East Anglia. IPVI and NDVI have a direct linear relationship whereas the other indices show considerable scatter at higher vegetation densities. |
||
|
||
|
Simple formula document which generates a Normalised Difference Vegetation Index (NDVI) image from a pair of red and near-IR images. |
|
|
|
The equation for the Angular Vegetation Index involves the green, red and near infra-red wavebands. λ1, λ2, and λ3 are the mid-band wavelengths for the green, red and NIR bands and tan-1 is the arctangent function. |
 Previous: Mini-lesson 7
|
Last update: 31 January 2018 | Contact |  |
Site Policy |
Next: Classification

|