


Mini-Lesson 3: Advanced use of formulas
Lesson Aims:To introduce you to some advanced uses of formula documents using Boolean algebra, trigonometric functions, modular arithmetic, and x, y constructs (which allow you to refer to specific pixels in an image by their column (x) and row (y) coordinates). Objectives:By the end of this mini-lesson you will have explored new aspects of the functionality of formula documents, and gained a broader understanding of Boolean logic and how formula documents can be applied in remote sensing and GIS.
Download the lesson:
Content OverviewThis mini-lesson builds on the Introduction to Bilko Tutorial 10: Using formulas to perform calculations on images and introduces additional functions that are useful in manipulating images. It is perhaps most useful for those who teach remote sensing or have an interest in using Bilko image stacks like layers in a Geographic Information System (see also Mini-lesson 4: Simple GIS exercise using Bilko). Each section introduces new aspects of formula use, with example formula documents to guide you in various ways of achieving the desired outputs. If needed, the example formulas can serve as templates which can be modified to achieve your own aims with other images. Sample images:A selection of images from this mini lesson are shown below. |
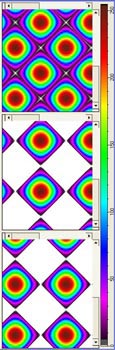
The results of the sine and cosine formula document statements. |
|
Boolean logic:
Formula document showing 4 methods of performing an AND operation on three images. Only Method 1 is active, with the statements for the other methods commented out. Adding a #before the Method 1 statement and deleting the # before the Method 2 statement will make that active. This allows the effects of each method to be tested in turn. |
|
||||||||||
Trigonometric functions: | |||||||||||
Formula document using trigonometric functions to set up two-dimensional sine and cosine pattern images, and then add the two patterns together. |
| ||||||||||
|
The results of the sine (left) and cosine (middle) formula document statements. The righthand image in the connected, tiled, window shows the result of adding the left and middle images together. A palette has been applied to display the patterns clearly.
|
|||||||||||
Using modular arithmetic to create a grid on an image:
A formula using x, y constructs and modular arithmetic to draw a grey and white grid pattern. X and y refer to column and row coordinates. |
White and grey grid generated by the formula document. |
||||||||||


 Previous: Mini-lesson 2
|
Last update: 31 January 2018 | Contact |  |
Site Policy |
Next: Mini-lesson 4

|