


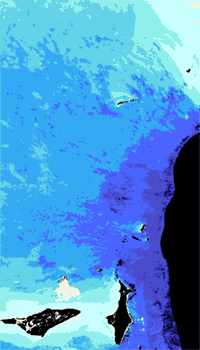
6. Crude bathymetric mapping using Landsat TM satellite imagery
Author: Dr Alasdair J.Edwards, University of Newcastle, UK.
Aim of Lesson
To demonstrate the effects of image spatial resolution (ranging from 1 m to 80 m) on your ability to discriminate between different coastal habitats.
Learning Objectives
- To understand the rationale and assumptions underlying the depth of penetration zone method of Jupp (1988) for mapping bathymetry.
- To learn how to sample deep-water pixels to determine maximum DN values returned over deep water for Landsat Thematic Mapper (TM) bands 1 to 4.
- To learn how to derive maximum depth of penetration estimates for Landsat TM bands 1 to 4 for the Caicos Bank using UTM coordinate referenced field survey data of depths.
- To learn how to combine these data to define depth of penetration (DOP) zones, assign pixels to these zones, and display a very crude bathymetric map of these depth zones.
- To refine this map by interpolation using information on maximum and minimum DN values in each DOP zone and create an image where pixel values correspond to depth.
- To learn how to create a palette to display depth contours effectively.
- To investigate the limitations of the method in terms of the accuracy of image-predicted depths.
How to download the lesson
 Previous: Lesson 5
|
Last update: 20 August 2018 | Contact |  |
Site Policy |
Next: Lesson 7

|