


Observing the Ocean from Envisat
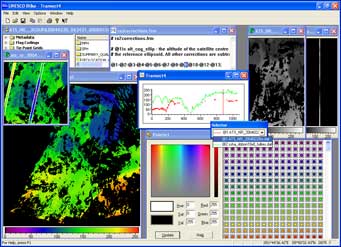
Available lessons from the Bilko Envisat Module
Editor: Valborg Byfield, National Oceanography Centre, Southampton, UK.
These lessons on applications of data from the European Space Agency's ENVISAT satellite are available in HTML format and may be viewed using any web browser with Java-script enabled. Background information is provided using pop-ups, so if you use the lessons, please make sure that your browser will allow these.
The lessons may be downloaded and used off-line by following the links at the top of each lesson. Each lesson download consists of
A zip file containing the lesson, with all necessary files in the directory structure required for the lessons to work. Please note that if you download a single lesson, links to other lessons or the introductory tutorial will not work, until these also have been downloaded.
A zip file containing all images and tools necessary to complete the lesson. Large images may also be downloaded individually. We recommend this option if you are downloading over a slow or unreliable connection.
The lesson names in the list below link to an on-line version of the lesson. To work off-line please download the lesson and images follow the links at the top of each lesson.
|
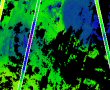
L2. Internal WavesAuthors: J.daSilva, University of Lisbon, PL; V.Byfield, National Oceanography Centre, Southampton, UK.
The characteristic signatures of IWs, alternating bands of light and dark strips are among the most easily recognized phenomena observed in remote sensing imagery. The case studies in this lesson demonstrate methods for studying IWs observed in ERS, ASAR and MERIS images.
|

|
L3. Sea surface temperature (SST) from AATSRAuthors: C.Donlon, The Met Office, UK; V.Byfield, National Oceanography Centre, Southampton, UK.
AATSR is the third in a series of instrument providing highly accurate SST measurements for use in climate research.
This lesson shows how measurements of sea surface skin temperature are derived from AATSR top of the atmosphere
(TOA) data products.
|
|
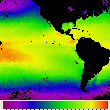
L4. Global sea surface temperature patternsAuthor: C.Donlon, The Met Office, UK.
SST is widely used to study upper ocean physical and biogeochemical processes and as an indicator for climate variation.
This lesson teaches how to understand and utilize global SST data products derived from microwave and infrared satellite instruments.
|
|
L5. The Benguela Current SystemAuthors: F.Shillington, S.Bernard, N.Chang, University of Cape Town, ZA; V.Byfield, National Oceanography Centre, Southampton, UK.
One of four eastern boundary upwelling systems, the Benguela is highly productive and supports one of the world's
richest fisheries. Using the Benguela as an example, the lesson shows how data from MERIS, AATSR
and other sensors are used to study the physical and biological processes characteristic of
coastal upwelling regions.
|
|
L6. Ocean eddiesAuthors: D. McNeall and V. Byfield, National Oceanography Centre, Southampton, UK.
Eddies can cause large changes in current speed and direction over small areas,
and are one of the main mechanisms for mixing water from different sources.
The lesson shows how measurements of sea surface temperature (SST) and height (SSH) from Envisat
and other satellites are used to study these highly dynamic features.
|
 Previous: Ocean forecasting
|
Last update: 01 April 2019 | Contact |  |
Site Policy |
Next: Module 7

|