


|
Using Hovmöller plots to study propagating featuresAuthors: Val Byfield, Stewart Bernard and Christo Whittle
|

|
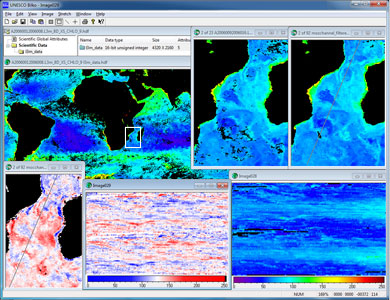
Screenshot from the lessons showing one of the global images (top left), sets of images before and after gap-filling (top right), an anomaly image after subtraction of the seasonal cycle (bottom right) and Hovmöller plots for the anomaly time series, and the ordinary time series (bottom middle and right).
Hovmöller plots are used to investigate the propagation of planetary waves or eddies. The plots are created by plotting how pixels values along a transect (x-axis) change with time (y-axis). They are often used with anomaly data (data that show how individual images differ from the mean value of a time series).
This lesson shows how to use Bilko transects to create Hovmöller plots and anomaly images. By the end of these lessons you should be able to:
- create Bilko sets covering a region of interest extracted from larger (global) images,
- understand how to use transects to create a Hovmöller plot,
- interpret the plot and understand how it can be used to describe the movement of current eddies,
- create a time series of anomaly data by subtracting the climatology.
Download the lesson:
Note: The image data for this lesson is almost 1GB in size.
 Previous: Mozambique Channel
|
Last update: 27 November 2019 | Contact |  |
Site Policy |
Next: EAMNet lesson 3

|