


|
DevCoCast Lessons |

|
Lessons to support marine data distributed via GEONETCast
The lessons listed below were developed to support marine data distributed via GEONETCast as part of the DevCoCast project (2008-2011), with funding from the 7th Framework Programme for Research and Technological Development (FP7) of the European Community.
|
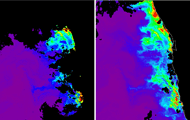
Study of an algal bloom off the coast of Namibia
Using a phytoplankton bloom from the Benguela upwelling system as an example, this lesson shows how Bilko formulae may be used to create composites of images from several days. A separate mini-lesson shows how to fill small gaps in the data using median interpolation.
|
|
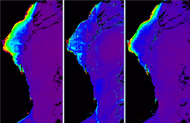
Ocean colour products from the Mozambique Channel
Ocean optics commonly classifies water into two types: Case 1 water is open ocean water, where optical properties are influenced only by phytoplankton concentrations; Case 2 water is water where sediment and dissolved organic matter from land run-off also plays a role. Calculations of chlorophyll concentration must take this difference into account. The lesson uses data from MERIS and MODIS sensors to investigate this issue.
|
|
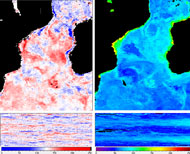
Using Hovmöller plots to study propagating features (mini-lesson)
Hovmöller plots display time series data in a form that allows you to detect moving features such as planetary waves and eddies.
This lesson uses 9km global global ocean colour data to show how to create a time series from a region of interest,
use transects to create a Hovmöller plot, and how to create a time series of anomaly data. |
 Previous: Module 8
|
Last update: 27 November 2019 | Contact |  |
Site Policy |
Next: EAMNet Lessons

|