 |
|
 |
|
Observing the Ocean from Envisat |
|
|
|

|
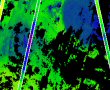
L2. Internal Waves
The characteristic signatures of IWs, alternating bands of light and dark strips are among
the most easily recognized phenomena observed in remote sensing imagery.
The case studies in this lesson demonstrate methods for studying IWs observed in ERS, ASAR and MERIS images.
Author: J.daSilva, University of Lisbon, PL, with V.Byfield, NOC, Southampton, UK.
|
|
L3. Sea surface temperature (SST) from AATSR
AATSR is the third in a series of instrument providing highly accurate SST measurements for use in climate research.
This lesson shows how measurements of sea surface skin temperature are derived from AATSR top of the atmosphere
(TOA) data products.
Author: C.Donlon, The Met Office, UK, with V. Byfield, NOC, Southampton, UK.
|
|
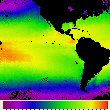
L4. Global sea surface temperature patterns
SST is widely used to study upper ocean physical and biogeochemical processes and as an indicator for climate variation.
This lesson teaches how to understand and utilize global SST data products derived from microwave and infrared satellite instruments.
Author: C.Donlon, The Met Office, UK
|
|
L5. The Benguela Current System
One of four eastern boundary upwelling systems, the Benguela is highly productive and supports one of the world's
richest fisheries. Using the Benguela as an example, the lesson shows how data from MERIS, AATSR
and other sensors are used to study the physical and biological processes characteristic of
coastal upwelling regions.
Authors: F.Shillington, S.Bernard, N.Chang, University of Cape Town, ZA, with V.Byfield, NOC.
|
|
L6. Ocean eddies
Eddies can cause large changes in current speed and direction over small areas,
and are one of the main mechanisms for mixing water from different sources.
The lesson shows how measurements of sea surface temperature (SST) and height (SSH) from Envisat
and other satellites are used to study these highly dynamic features.
Authors: D.McNeall and V.Byfield, National Oceanography Centre, Southampton, UK.
|


