


|
|
Using a monthly SST climatology to analyse seasonal variability |
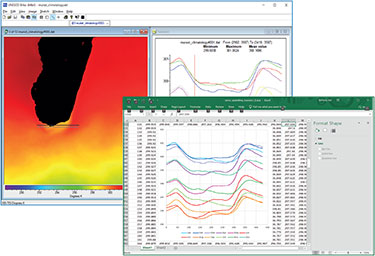
Screenshot from the lessons showing a transect across coastal upwelling south of Madagascar (left), and the transect copied to and Excel spreadsheet for formatting and further analysis(right).
Climatology data is important for understanding seasonal variability.
It is the long-term average of a given variable, usually calculated over 30 years,
if a time series of this length is available.
A monthly climatology will produce a mean value for each of the twelve months; a weekly climatology will produce a mean value for each of the 52 weeks of the year. Climatologies show the typical conditions to be found in a region of interest at different times of year.
This tutorial shows how to calculate a monthly climatology for the Western Indian Ocean by using Bilko in Batch mode to apply a formula document to a Bilko SET – a list of data sets containing monthly SST data from 2003 to 2017.
NOTE: This lesson requires a minimum of 20 GB free disk space due to the large data sets.
Learning objectives
By the end of the lesson you should be able to
- identify the different components of a Bilko formula designed to calculate a monthly climatology
- create a Bilko SET document to list the input data
- run the formula in Batch mode to create the climatology
- use transects and data cores to analyse the seasonal variability seen in the output data
Full lesson in PDF format
Download data and tools to complete the lesson
| Last update: 19 January 2021 | Contact |  |
Site Policy |
Next: calculating SST anomalies

|